The Save My Cents don’t budget by month. I mean, while we have a general sense of how much we should spend by month, we never beat ourselves up for a month where we are on- budget or not.
We have so many fluctuating annual expenses that make some months look upside down
- Every December we gift out a few hundred in Christmas gifts
- Every May I put in a few thousand towards my whole life insurance policy
- Every October our homeowners insurance policy is due, which is over $1,000
- When we do our one big international travel trip of the year (pre-COVID times) we might spend a few thousand in a week’s time
You might also have many of these expenses that can make a single month look over-budget, such as…
- Annual holiday gifting and travel traditions
- Car registration and license fees, annual check-ups
- Home heating bills (in the Northeast, many homes use oil tank fill-ups, which can be several hundred dollars for a few months all at once)
- Vet visits for your pets, including vaccinations
- Property taxes for your home, if you do not pay via escrow
- Estimated quarterly taxes for your small business
- Sporting club renewal fees, school fees, summer camp
- And more…
The solution: Last Twelve Month Average
So instead, while we enter our incomes and expenses monthly into our budgeting software (we use an outdated software – Money by Microsoft), we also separately on an Excel sheet track the Last Twelve Month Average for all key categories, including:
- Total spending
- Total needs spending
- Total wants spending
Calculating the Last Twelve Month Average is simple. Take all the expenses you have in any category for the last month, and divide it by 12, to get after a “true” monthly average for this category. This metric smooths out the monthly ups and downs.
When you first start budgeting, this metric could change a lot each month as you establish your first year’s budget.
The beauty of this metric really starts after you have about 6 months of data. Then your spending starts to average out. Then, if at any time you start noticing this Last Twelve Month Average start to increase by a lot each month, it is a good indicator that this is a category where you are increasing costs.
Adjust for inflation
Each year, we adjust our Last Twelve Month Average expectation upwards by about ~2-3% to account for inflation. For example, our property taxes always go up. Our maintenance fee for our home (which includes a significant portion earmarked for our union-based doormen), also goes up. Groceries creep up each year with inflation. We don’t beat ourselves up over inflation-driven cost increases.
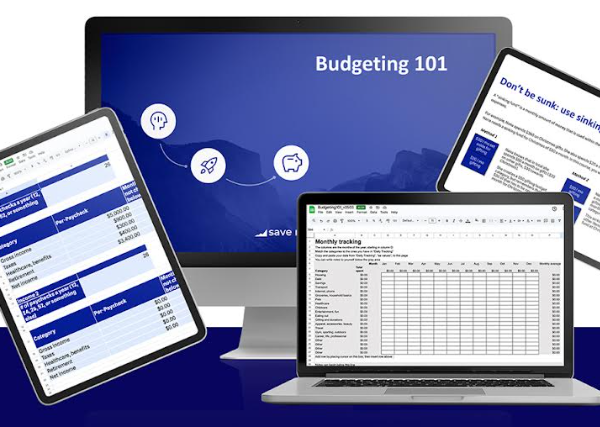
Are you super-new to budgeting or don’t know how to do it? You may benefit from my free First Budgeting Spreadsheet download.
Here’s how to keep in touch with Save My Cents:
For community and conversation with each other, 2x a week: My Facebook group
For daily inspiration: My Instagram page
To learn directly from me: My courses and private coaching


